

A new map detailing croplands worldwide in the highest resolution yet, will help to ensure global food and water security in a sustainable way.
Mapping and monitoring global croplands over time is imperative for ensuring sustainable water and food security because farm management decisions can be based on information specific to the precise location of croplands and their dynamics, said USGS.
The map establishes that there are 1.87 billion hectares of croplands in the world, which is 15 to 20 percent, or 250 to 350 million hectares, higher than former assessments. The change is due to more detailed understanding of large areas that were never mapped before or were inaccurately mapped as non-croplands.
India is believed to have the biggest acreage agricultural acreage of any country across the world. A new study by the U.S. Geological Survey (USGS) shows that total global cropland totals 1.87 billion hectares (4.62 billion acres), is 15 percent to 20 percent higher than previous estimates. The increase is due to the assessment of areas previously mapped inaccurately, or left unmapped, according to the USGS.
At 179.8 million hectares, India outranks the 167.8 million hectares in the U.S. and China’s 165.2 million hectares. Europe along with South Asia are labeled “agricultural capitals of the world,” as cropland accounts for more than 80 percent of some countries in those regions. In comparison, only about a fifth of land in U.S. and China is dedicated to growing food. Statistics of every country in the world can be viewed in an interactive map.
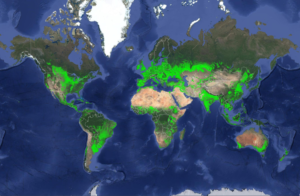
The map clearly shows individual farm fields, big or small, at any location in the world,” said Prasad Thenkabail, USGS research geographer. “Given the high resolution of 30 meters and 0.09 hectares per pixel, a big advantage is the ability to see croplands in any country and sub-national regions, including states, provinces, districts, counties and villages.
“Not only does this map and accompanying data have significant food security implications, but it is also critical as a baseline for assessing water security. Nearly 80 percent of all human water use across the world goes towards producing food, and this research provides insight on “crop per drop,” which is an assessment of the amount of crops produced per unit of water.”
USGS study used satellite images and big-data analytics, and is part of a NASA-funded project to provide high-resolution data on farmland and water use.
The USGS was created by an act of the U.S. Congress in 1879 and is the sole science agency of the U.S. Department of the Interior.